Picturing Quantum Processes
Quantum phenomena are explained through the language of diagrams, setting out an innovative visual method of presenting complex scientific theories. Focusing on physical intuition over mathematical formalism, and packed with exercises, this unique book is accessible to students and researchers across scientific disciplines, from undergraduate to Ph.D. level.
Stats for nerds
8recommend
13mentions
11people
2017–2026years
69% recommend31% neutral
Mentions per year
What Hacker News says
- Somewhat related: a book that really helped me is Picturing Quantum Processes by Bob Coecke. It's a visual representation of quantum processes, which really helped me understand the concept
- A string diagram represents a computation using a monoid (associative binary operator with a common left/right unit element). You can interpret the computation as a dataflow through the inputs and outputs of the operators. By further characterizing members of the set, you can add constraints on the types (parts) of the data flow along edges.
So they are just a monoid algebra, dressed up with category theory mumbo-jumbo: monoidal category.
The origins go back to Einstein Summation Convention for writing products in vector/matrix/tensor math. Albert got fed-up with writing all the correct free-bound indexes and ranges on fancy sigma summations, so he invented the lazy summation convention.
https://en.wikipedia.org/wiki/Einstein_notation
To make a dot product of two vectors they must have the same dimension. To multiply two matrices, the i-dimension (no. columns) of the first argument must equal the j-dimension (no. rows) of the second, and these will be consumed, then the result will retain the other two dimensions.
Not only are matrix multiplications non-commutative, but the output dimensions will be different depending on the order. For example, A32 x B23 = C22, but B23 x A32 = D33, note how the outer dims must be equal and are consumed, and the result has the inner dimensions.
Penrose was a specialist in GR, so he knew the summation convention in his bones. He was also a very visual mathematician, who had appreciated Feynman's diagrams as a planar graph representation of terms from a mathematical series expansion of the particle interaction. Penrose developed a diagram notation for tensor operations:
https://en.wikipedia.org/wiki/Penrose_graphical_notation
All this algebra can be categorified, expressed in the language of CT. The various behaviors of commutativity of the product give rise to a spectrum of categories (symmetric, braided, etc.), and these can be represented as properties of the diagrams. For example, braiding means the order is important, and the crossing of two edges in the planar graph has an algebraic meaning.
The best layman's introduction to how this ties together various parts of math, quantum physics and even computer science is: Baez, Stay "Physics, Topology, Logic and Computation: A Rosetta Stone" (2009)
https://math.ucr.edu/home/baez/rosetta.pdf
The theory and practice of applying string diagrams to quantum mechanics has been taken forward by Bob Coecke. Here are a couple papers that go through QM math, categories and string diagrams:
Categories for the Practising Physicist https://arxiv.org/abs/0905.3010
Categorical Quantum Mechanics I: Causal Quantum Processes https://arxiv.org/abs/1510.05468
(Section 3: String Diagrams)
His beautiful magnum opus is the book Picturing Quantum Processes (with Aleks Kissenger):
https://assets.cambridge.org/97811071/04228/frontmatter/9781...
- In some sense, classical probability is just the study of category of Markov Kernels [0]. We can gain much of the insight without a lot of measure theory/functional analysis machineries by restricting to its full subcategory of finite states, which gets us to the category of stochastic matrix.
In this view, quantum probability (of finite states) is just about study of category of classical quantum maps described in Picturing Quantum Processes by Bob Coecke and Aleks Kissinger [1]. I highly recommend the book, which requires hardly any prerequisites other than linear algebra and mathematical maturity. Once we get into this framework, no philosophical interpretation is required. E.g. we can't reproduce a quantum state by classical data just means any morphism from a (non-trivial) purely quantum state to a purely classical state does not have a left inverse.
[0]: https://en.wikipedia.org/wiki/Markov_kernel [1]: https://www.cambridge.org/core/books/picturing-quantum-proce...
- A friend has recommended Coecke and Kissinger's book, Picturing Quantum Processes, which takes an alternative conceptual approach to quantum computation based on string diagrams (not-so-secretly a formalism for working with various flavours of monoidal category, as explained in the optional sections) instead of linear algebra.
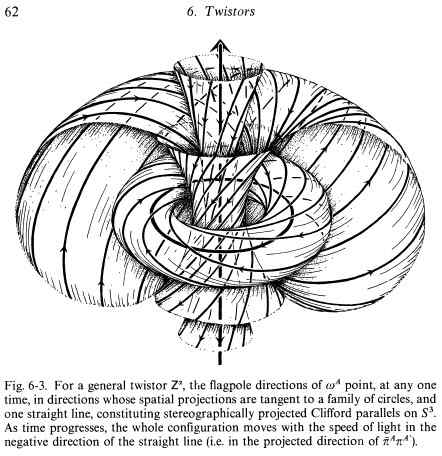
- I believe Roger Penrose draws all his own illustrations. For copius excellent examples, see his book Road to Reality. Here is one example:
https://phys.org/news/2018-03-math-bridges-holography-twisto...
https://theportal.wiki/images/1/11/Penrose-Rindler-Clifford-...
He also comes from the pre-ppt age of presenting with handwritten acetate transparencies - and still does afaik. Many of his slides have been captured for the infowebs.
http://cgpg.gravity.psu.edu/online/Html/Seminars/Fall1998/Pe...
http://cgpg.gravity.psu.edu/online/Html/Seminars/Fall1998/Pe...
Some of his original papers from the 1960s were not published at the time, but circulated as samizdat facsimiles of his handwritten notes, until later transcribed by professors or their students, then published in book collections:
http://math.ucr.edu/home/baez/penrose/Penrose-TheoryOfQuanti...
Penrose is famous for his visual imagination, which seems to ground many of his insights. Here is a paper where he invents a visual notation for tensors and operators:
https://en.wikipedia.org/wiki/Penrose_graphical_notation
http://homepages.math.uic.edu/~kauffman/Penrose.pdf
This has inspired recent work by Bob Coecke, as captured in his beautiful book Picturing Quantum Processes.
(arXiv example: https://arxiv.org/pdf/0908.1787.pdf)
- I've been really enjoying Picturing Quantum Processes by Coecke and Kissinger. It approaches QM by exploring Quantum Processes in terms of a sort of formalized flow diagram. Notions like entanglement and teleportation are pretty simple in these terms and occur in the first couple chapters.
They're natural consequences of the formalization being described and are explained as physical or visual consequences of moving different elements of the diagram around. This is pretty fascinating because the analysis feels informal given how fluent and visual it is, but it can be completely formalized through a logic of graph transformations which let you translate these graphs into algebraic equations.
I haven't finished the book yet, but building from this formalism they begin to demonstrate how this formalism appropriately describes Hilbert spaces (it's an abstract theory to the more concrete model of Hilbert spaces) which then get us very close to standard Quantum formalisms. You can already begin discussing qubits, various standard quantum bases, and basic computational reasoning based on these systems.
It's a really excellent!
Related
2017–2026
Quantum computing for computer scientists
10 recommend · 15

Quantum Computing Since Democritus
73 recommend · 131
2008–2016
Visual Quantum Mechanics
2 recommend · 2

Quantum Computer Science
11 recommend · 13

Quantum computation and quantum information
30 recommend · 41

Quantum psychology
16 recommend · 22