Say it with charts
"Say It With Charts, Fourth Edition, shows you how to put your message in visual form and translate information and ideas into persuasive, powerful charts, visuals, and multimedia presentations - holding your audience's attention as you communicate exactly what you want, with no confusion. The newest edition of this bestselling classic covers every important point from previous editions and, in addition, shows you how to use today's digital technologies to create professional-quality, attention-grabbing visuals on your computer screen."--BOOK JACKET.
Stats for nerds
3recommend
3mentions
3people
2009–2021years
100% recommend
Mentions per year
What Hacker News says
- In addition to a lot of the recos here, Gene Zelazny's "Say it with charts" is an old school book that a manager of mine had us read in concert with Tufte. It's a good simple primer on charts.
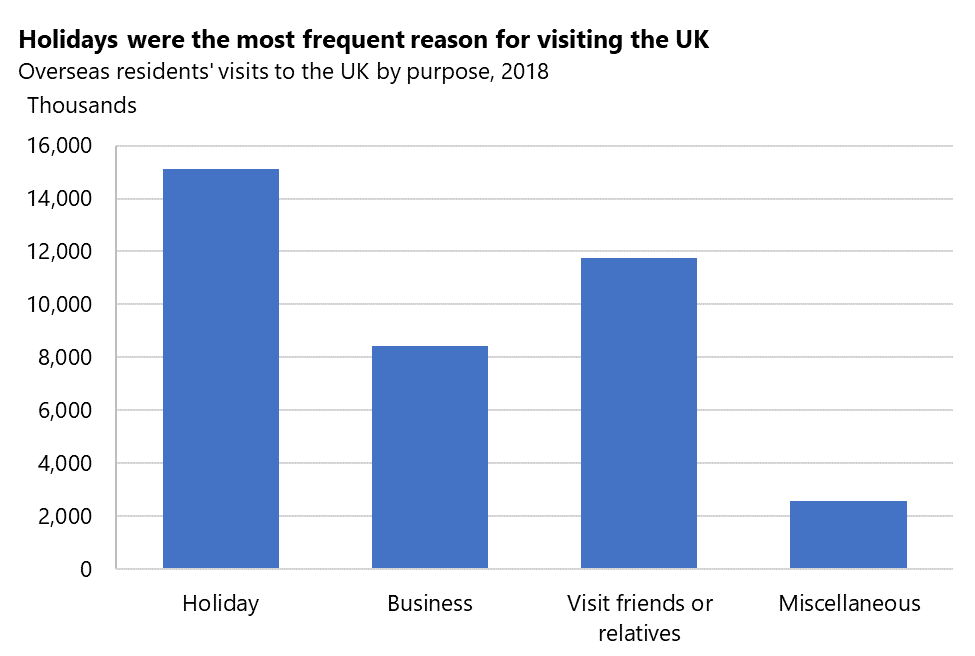
- This guide is nicely written, and mostly useful for tips on labelling, but some of the advice on choosing chart types is bad. There are several examples of column charts used for categorical data, e.g. https://gss.civilservice.gov.uk/wp-content/uploads/2020/04/b...
It's OK to use column charts where each column represents a category if and only if there's some ordinal nature along the x axis, i.e. if either of these are true:
A) The categories have a natural ordering (e.g. 'age group'), OR
B) The categories are ordered by their value on the y axis (i.e. the most popular 'reason for visiting the UK' is the first column, and the least popular on the right)
In other cases, a horizontal bar chart is preferable, as it does not lead the reader to mistakenly infer some ordinal relationship between the categories.
For learning how to choose a chart type, people should just buy Say it with charts (https://www.amazon.com/Say-Charts-Executives-Visual-Communic...), read it and complete the exercises.
BTW - another thing that bugs me about that chart: the y axis is labelled as 'thousands', but then the tick marks are labelled 2,000 to 16,000. It would better to use 2, 4, 6, ... for the tick marks, and label the axis as 'millions'. Even better would be to use percentages, and just mention N somewhere in the title.
Which of these charts is clearest? (top-left is the version in the linked guide, bottom-right is my preferred option): https://docs.google.com/spreadsheets/d/1JO2RXDQBJffWQ34QIi79...
- My recommendation here is: Zelazny, Gene - Say it with charts.